Sales
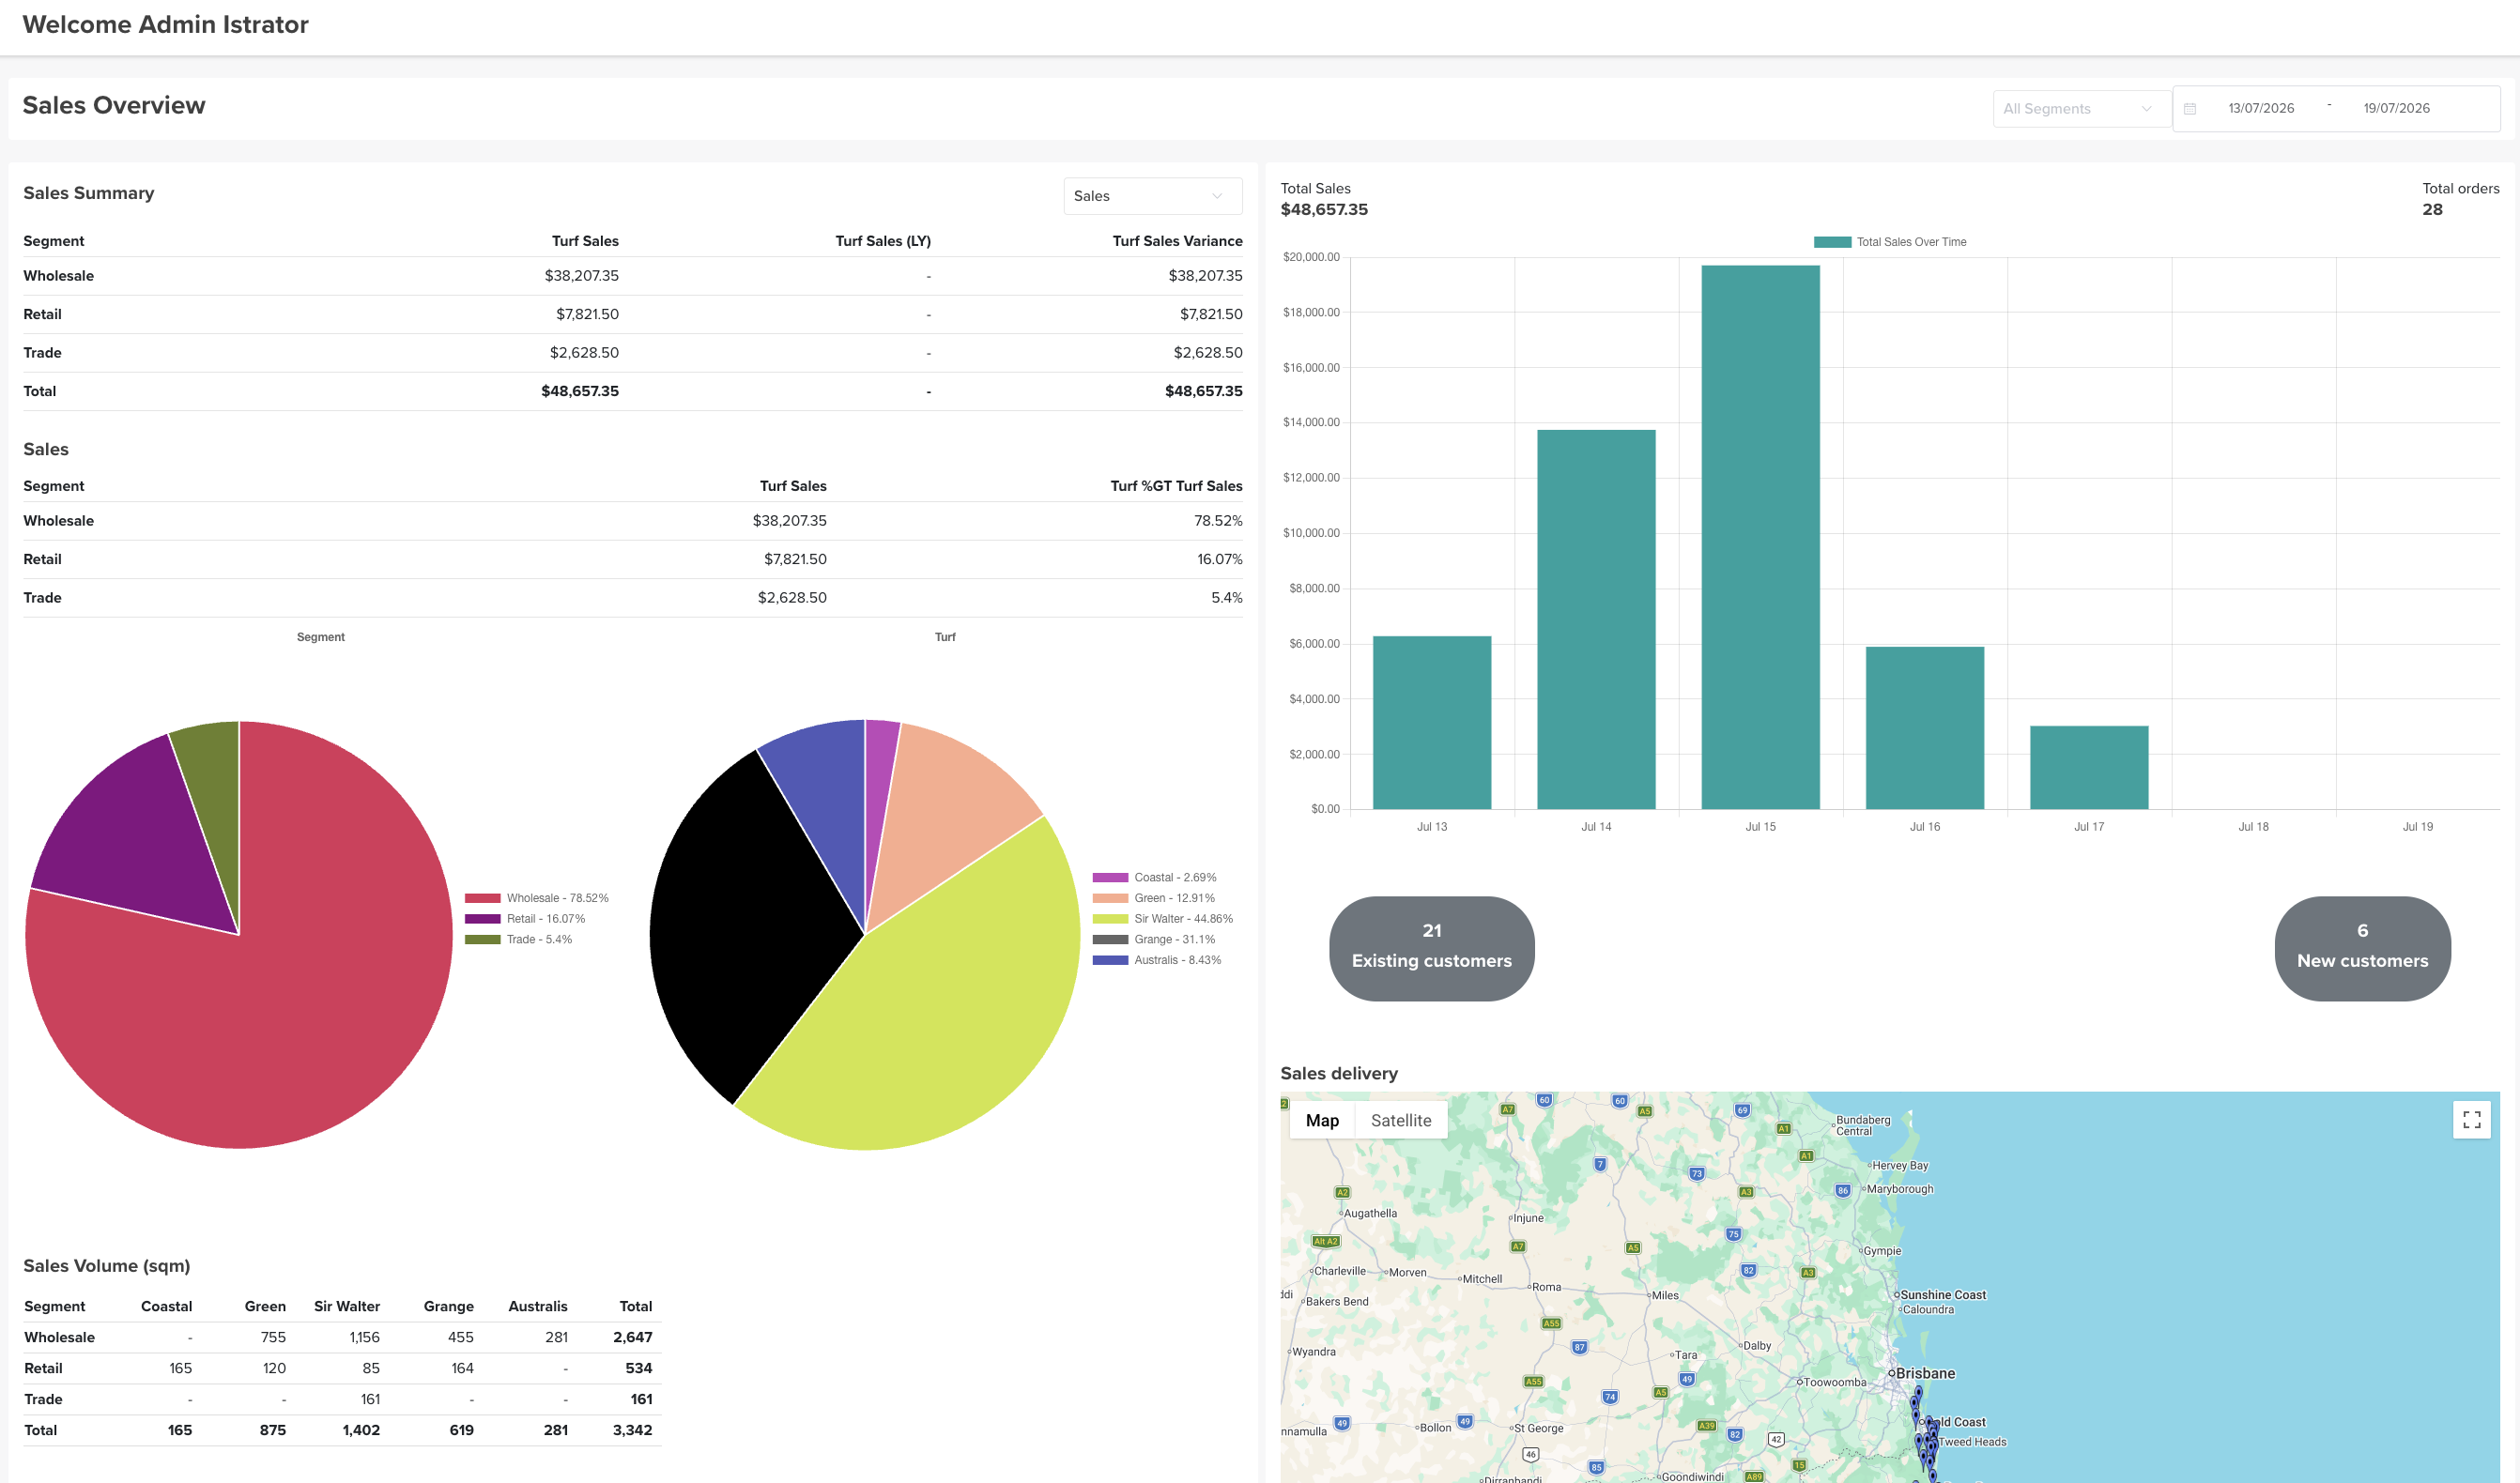
The Sales dashboard (titled Sales Overview) is a graphical view of your sales data — filterable by date range and segment — so you can read performance at a glance.
Where to find it
Top navigation → Sales.
Filters
- Segment — All Segments, or a single segment (Wholesale / Retail / Trade).
- Date range — the period to report on.
What it shows
- Sales Summary — by segment: Turf Sales, Turf Sales (LY) (last year) and the Variance, with a total row. A metric dropdown lets you switch what's summarised.
- Sales — by segment: Turf Sales and each segment's % of total turf sales.
- Pie charts — sales split by Segment and by Turf variety.
- Total Sales and Total orders for the period.
- Total Sales Over Time — a bar chart by day.
- Existing vs New customers — counts for the period.
- Sales delivery — a map of where orders are going.
- Sales Volume (sqm) — square metres by segment and variety, with totals.